| Kachel | Bild | Wert | Beschreibung |
|---|
| Agenten Kuchen | 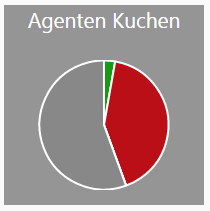 | Berechnung: var wallboard2StatisticsAgentsPie_pieData = [
{
value: #{item.agentsFree},
color:"#169A13"
},
{
value : #{item.agentsBusy},
color : "#BB0F18"
},
{
value : #{item.agentsPause},
color : "#FFFF66"
},
{
value : #{item.agentsPostCall},
color : "#FCC10F"
},
{
value : #{item.agentsTotal -
item.agentsFree -
item.agentsBusy -
item.agentsPause -
item.agentsPostCall},
color : "#888888"
}]; | Zeigt ein Kuchendiagramm der Agentenstati mit folgenden Farben / Daten: Grün = "Supervisor - Echtzeit - Agenten - Frei". Rot = "Supervisor - Echtzeit - Agenten - Im Gespräch". Gelb = "Supervisor - Echtzeit - Agenten - Pause". Orange = "Supervisor - Echtzeit - Agenten - Nachbearbeitung". Grau = Gesamtzahl der Agenten minus allen anderen Werten. |
| Agenten Polar | 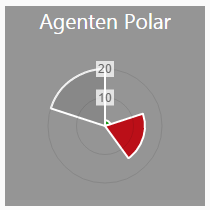 | Gleiche Datenbasis wie Agenten Kuchen. | Zeigt als Polardiagramm die gleichen Daten an, wie der Agenten Kuchen. |
| Akt. Servicelevel Tacho % | 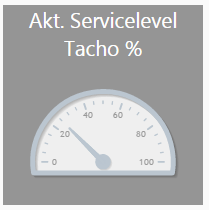 | Berechnung: <ui:param name="item_serviceLevelPercent" value="#{item.actCalls eq 0 ? 0 : item.inServiceCalls * 100 / item.actCalls}"/> Anzeige: #{acdSupervisorGraphDataBean.serviceLevelGaugeData(item_serviceLevelPercent)} | Zeigt den Wert "Supervisor - Echtzeit - ServiceLevel" als Tachonadel an. |
| Servicelevel Heute Tacho % | 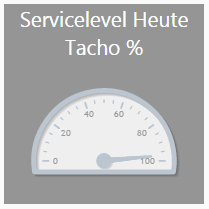 | Berechnung: <ui:param name="item2_serviceLevelPercent" value="#{item2.TodayGroupCalls eq 0 ? 0 : item2.TodayVariableInServiceLevelCalls * 100 / item2.TodayGroupCalls}"/> Anzeige: #{acdSupervisorGraphDataBean.serviceLevelGaugeData(item2_serviceLevelPercent)} | Zeigt den Wert "Supervisor - Tagesstatistik - ServiceLevel - In Service" als Tachonadel an. |
| Anrufe Heute Liniendiagramm | 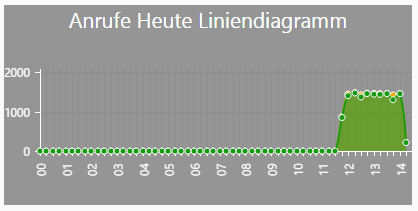 | Berechnung: DataCache_AcdGroups_TodaysGraphData.sql Anzeige: var wallboard2StatisticsCallsTodayGraph_group_#{item.ID}_Data = {
labels : #{acdSupervisorGraphDataBean.callCountersGraphLabels(item.ID)},
datasets : [
{
fillColor : "rgba(230,170,0,0.5)",
strokeColor : "rgba(230,170,0,1)",
pointColor : "rgba(230,170,0,1)",
pointStrokeColor : "#fff",
data : #{acdSupervisorGraphDataBean.callCountersIncomingCalls(item.ID)}
},
{
fillColor : "rgba(22,154,19,0.5)",
strokeColor : "rgba(22,154,19,1)",
pointColor : "rgba(22,154,19,1)",
pointStrokeColor : "#fff",
data : #{acdSupervisorGraphDataBean.callCountersServicedCalls(item.ID)}
}
]
}; | Zeigt folgende Daten als Liniendiagramm an: Gelb: IncomingCalls für den jeweiligen Zeitraum. Grün: ServicedCalls für den jeweiligen Zeitraum. |
| Anrufe Heute Balkendiagramm | 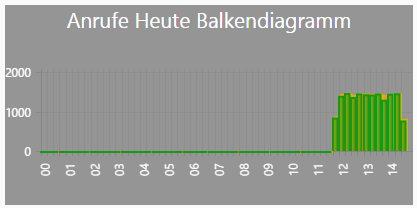 | Gleiche Datenbasis wie Anrufe Heute Liniendiagramm. | Zeigt als Balkendiagramm die gleichen Daten an wie "Anrufe Heute Liniendiagramm". |
| Service und Erreichbarkeit Diagramm |  | Anzeige: var wallboard2StatisticsReceivedWithServiceAndAvailabilityGraph_group_#{item.ID}_Data = {
labels : #{acdSupervisorGraphDataBean.callCountersGraphLabels(item.ID)},
datasets : [
{
fillColor : "rgba(255,0,0,0.5)",
strokeColor : "rgba(255,0,0,1)",
pointColor : "rgba(255,0,0,1)",
pointStrokeColor : "#fff",
data : #{acdSupervisorGraphDataBean.callCountersIncomingCalls(item.ID)}
},
{
fillColor : "rgba(0,0,255,0.4)",
strokeColor : "rgba(0,0,255,1)",
pointColor : "rgba(0,0,255,1)",
pointStrokeColor : "#fff",
data : #{acdSupervisorGraphDataBean.callCountersServicedCalls(item.ID)}
},
{
fillColor : "rgba(0,255,0,0.3)",
strokeColor : "rgba(0,255,0,1)",
pointColor : "rgba(0,255,0,1)",
pointStrokeColor : "#fff",
data : #{acdSupervisorGraphDataBean.callCountersInServiceCalls(item.ID)}
},
{
fillColor : "rgba(100,0,0,0.2)",
strokeColor : "rgba(100,0,0,1)",
pointColor : "rgba(100,0,0,1)",
pointStrokeColor : "#fff",
data : #{acdSupervisorGraphDataBean.callCountersShortHangupCalls(item.ID)}
},
{
fillColor : "rgba(0,255,255,0.1)",
strokeColor : "rgba(0,255,255,1)",
pointColor : "rgba(0,255,255,1)",
pointStrokeColor : "#fff",
data : #{acdSupervisorGraphDataBean.callCountersTransferCalls(item.ID)}
}
]
}; | Zeigt als Liniendiagramm folgende Werte an: Rot: IncomingCalls Blau: ServicedCalls Grün: InServiceCalls Dunkelrot / Braun: ShortHangupCalls Cyan: TransferCalls |
| Service und Erreichbarkeit Diagramm Eingegangen, Bearbeitet und In Service |  | Anzeige: var wallboard2StatisticsReceivedWithServiceAndAvailabilityGraph2_group_#{item.ID}_Data = {
labels : #{acdSupervisorGraphDataBean.callCountersGraphLabels(item.ID)},
datasets : [
{
fillColor : "rgba(255,0,0,0.5)",
strokeColor : "rgba(255,0,0,1)",
pointColor : "rgba(255,0,0,1)",
pointStrokeColor : "#fff",
data : #{acdSupervisorGraphDataBean.callCountersIncomingCalls(item.ID)}
},
{
fillColor : "rgba(0,0,255,0.4)",
strokeColor : "rgba(0,0,255,1)",
pointColor : "rgba(0,0,255,1)",
pointStrokeColor : "#fff",
data : #{acdSupervisorGraphDataBean.callCountersServicedCalls(item.ID)}
},
{
fillColor : "rgba(0,255,0,0.1)",
strokeColor : "rgba(0,255,0,1)",
pointColor : "rgba(0,255,0,1)",
pointStrokeColor : "#fff",
data : #{acdSupervisorGraphDataBean.callCountersInServiceCalls(item.ID)}
}
]
}; | Zeigt als Liniendiagramm folgende Werte an: Rot: IncomingCalls Blau: ServicedCalls Grün: InServiceCalls
|
| Service und Erreichbarkeit Diagramm Kurzabbrecher und Weitergeleitet |  | Anzeige: var wallboard2StatisticsReceivedWithServiceAndAvailabilityGraph3_group_#{item.ID}_Data = {
labels : #{acdSupervisorGraphDataBean.callCountersGraphLabels(item.ID)},
datasets : [
{
fillColor : "rgba(100,0,0,0.5)",
strokeColor : "rgba(100,0,0,1)",
pointColor : "rgba(100,0,0,1)",
pointStrokeColor : "#fff",
data : #{acdSupervisorGraphDataBean.callCountersShortHangupCalls(item.ID)}
},
{
fillColor : "rgba(0,255,255,0.3)",
strokeColor : "rgba(0,255,255,1)",
pointColor : "rgba(0,255,255,1)",
pointStrokeColor : "#fff",
data : #{acdSupervisorGraphDataBean.callCountersTransferCalls(item.ID)}
}
]
}; | Zeigt als Liniendiagramm folgende Werte an: Dunkelrot: ShortHangupCalls Cyan: TransferCalls |
| Up- und Downskill Agenten Anruf-Grafik |  Image Added Image Added | Anzeige: var wallboard2FirstSecondLevelGraph_group_#{item.ID}_Data = {
labels : #{acdSupervisorGraphDataBean.callCountersGraphLabels(item.ID)},
datasets : [
{
fillColor : "rgba(225,0,0,0.5)",
strokeColor : "rgba(225,0,0,0.8)",
highlightFill: "rgba(255,0,0,0.75)",
highlightStroke: "rgba(255,0,0,1)",
data : #{acdSupervisorGraphDataBean.callCountersNotServicedCalls(item.ID)}
},
{
fillColor : "rgba(0,100,0,0.5)",
strokeColor : "rgba(0,100,0,0.8)",
highlightFill: "rgba(0,100,0,0.75)",
highlightStroke: "rgba(0,100,0,1)",
data : #{acdSupervisorGraphDataBean.callCountersDownSkillCalls(item.ID)}
},
{
fillColor : "rgba(22,154,19,0.5)",
strokeColor : "rgba(22,154,19,0.8)",
highlightFill: "rgba(22,154,19,0.75)",
highlightStroke: "rgba(22,154,19,1)",
data : #{acdSupervisorGraphDataBean.callCountersSameSkillCalls(item.ID)}
},
{
fillColor : "rgba(144,238,144,0.5)",
strokeColor : "rgba(144,238,144,0.8)",
highlightFill: "rgba(144,238,144,0.75)",
highlightStroke: "rgba(144,238,144,1)",
data : #{acdSupervisorGraphDataBean.callCountersUpSkillCalls(item.ID)}
}
]
}; | Zeigt als gestapelte Balkengrafik folgende Daten an: Rot: NotServicedCalls Hellgrün: UpSkillCalls Mittelgrün: SameSkillCalls Dunkelgrün: DownSkillCalls |


