...
| Variable | Wert |
|---|
$INTERVAL_MINUTES |
|
...
 Image Added Image Added
| $SERVICE_LEVEL_SECONDS |
|
...
 Image Added Image Added
| | $SHORT_HANGUP_SECONDS |
|
...
Daten für Grafiken
...
 Image Added Image Added
|
Data for Graphs |
...
| DataCache_AcdGroups_TodaysGraphData.sql |
|
...
| Tables | AcdStatisticsPartB, StatisticsPartB |
|
...
FROM AcdStatisticsPartB acdb
LEFT JOIN StatisticsPartB b
ON ( acdb.StatisticsPartAID = b.StatisticsPartAID )
AND
( b.ID = ( SELECT MIN(ID) FROM StatisticsPartB bb WHERE bb.StatisticsPartAID = acdb.StatisticsPartAID ) )
WHERE ( acdb.AcdGroupsID = $ACDGROUPSID )
AND
( dtGroupStart >= DATETIME( DATE( 'now', 'localtime' ) ) )
AND
( dtGroupEnd IS NOT NULL )
...
(CACHE) | | Restriction | Calls for the respective ACD group in the displayed period, only completed calls. |
| Wert | Kommentar |
|---|
| Interval | The respective interval in the course of the day from 0 ... 23 (for hours), from 0 ... 47 (for 30 minute intervals) and 0 ...95 (for 15 minute intervals). | | IncomingCalls | Number of incoming calls to the ACD group in the respective time interval. | | ServicedCalls | Number of calls that were transferred to an agent in the respective time interval. | | InServiceCalls | Number of calls transferred to an agent within the set $SERVICE_LEVEL_SECONDS in the respective time interval. | | ShortHangupCalls | Number of calls that have hung up in the ACD queue within the set $SHORT_HANGUP_SECONDS in the respective time interval | | TransferCalls | Number of calls that were forwarded in the respective time interval. | | DownSkillCalls | Number of calls that were transferred to an agent who was assigned a higher skill by a skill correction in the respective time interval. | | SameSkillCalls | Number of calls that were transferred to an agent who was not assigned a skill correction in the respective time interval. | | UpSkillCalls | Number of calls that were transferred to an agent who had been assigned a lower skill by a skill correction in the respective time interval. |
| Kachel | Bild | Beschreibung |
|---|
| Agents Pie | 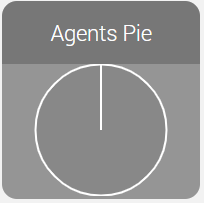 Image Added Image Added
| Shows a pie chart of agent states with the following colors / data: - Green = "Supervisor - Real-time - Agents - Free".
- Red = "Supervisor - Real-time - Agents - In Call".
- Yellow = "Supervisor - real-time - agents - pause".
- Orange = "Supervisor - real-time - agents - post-processing".
- Grey = total number of agents minus all other values.
| | Agents Polar | 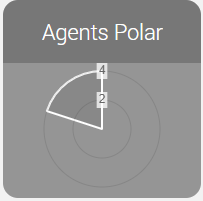 Image Added Image Added
| Displays the same data as the agent cake as a polar diagram. | | Current Service Level Gauge % |  Image Added Image Added
| Displays the value "Supervisor - real-time - service level" as a speedometer. | | Service Level Today Gauge % |  Image Added Image Added
| Displays the value "Supervisor - Daily statistics - Service level - In Service" as a speedometer. | | Calls Today Graph | 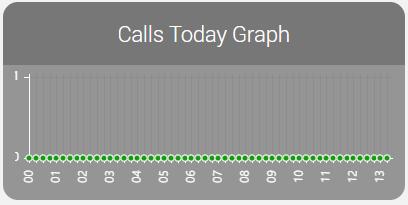 Image Added Image Added
| Displays the following data as a line chart: - Yellow: IncomingCalls for the respective period.
- Green: ServicedCalls for the respective period.
| | Calls Today Bar Chart | 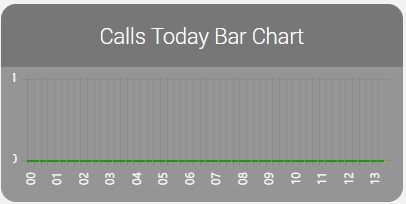 Image Added Image Added
| Displays the same data as "Calls Today Line Chart" as a bar chart. | | Service and Availability Graph | 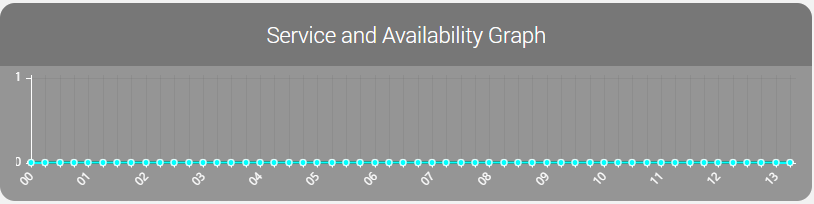 Image Added Image Added
| Displays the following values as a line chart: - Red: IncomingCalls
- Blue: ServicedCalls
- Green: InServiceCalls
- Dark red / brown: ShortHangupCalls
- Cyan: TransferCalls
| | Service and Availability Graph Incomming, In Service And In Serviced | 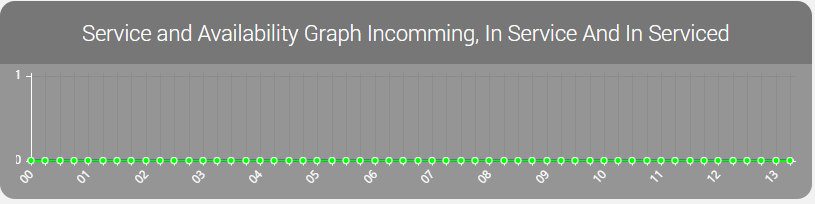 Image Added Image Added
| Displays the following values as a line chart: - Red: IncomingCalls
- Blue: ServicedCalls
- Green: InServiceCalls
| | Service and Availability Graph Short Hangups And Transfer | 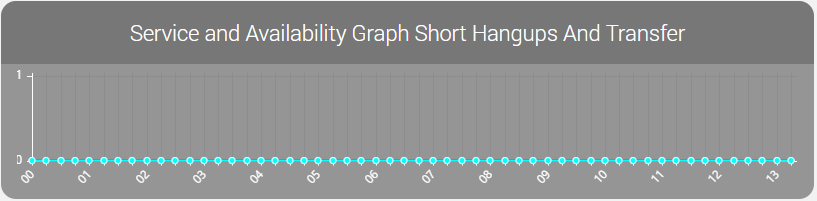 Image Added Image Added
| Displays the following values as a line chart: - Dark red: ShortHangupCalls
- Cyan: TransferCalls
| | Up- and Down-Skill Agent Calls Graph | 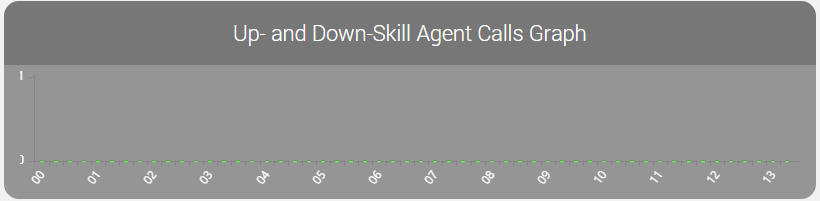 Image Added Image Added
| Displays the following data as a stacked bar graph: - Red: NotServicedCalls
- Light green: UpSkillCalls
- Medium green: SameSkillCalls
- Dark green: DownSkillCalls
|
|
| Sv translation |
|---|
|
Daten für Grafiken| Wert | Kommentar |
|---|
| Quelle | DataCache_AcdGroups_TodaysGraphData.sql | | Tabellen | AcdStatisticsPartB, StatisticsPartB (CACHE) | | Eingrenzung | Anrufe für die jeweilige ACD Gruppe im angezeigten Zeitraum, nur abgeschlossene Anrufe. |
| Wert | Kommentar |
|---|
| Interval | Das jeweilige Intervall im Tagesverlauf |
|
...
| von 0 .. 23 (bei Stunden), von 0 .. 47 (bei 30 Minuten Intervalle) sowie 0..95 (bei 15 Minuten Intervalle). |
|
...
Summierung:
...
| Anzahl der eingehenden Anrufe auf die ACD Gruppe |
|
...
| im jeweiligen Zeitintervall. | | ServicedCalls |
|
...
Berechnung:
CASE
WHEN dtAgentConnect IS NOT NULL THEN 1
ELSE 0
END AS IsAgentCall,
Summierung:
IFNULL( SUM( GroupCalls.IsAgentCall ), 0 ) AS ServicedCalls,
...
| Anzahl der Anrufe, die an |
|
...
| einen Agenten vermittelt wurden |
|
...
| im jeweiligen Zeitintervall. |
|
...
Berechnung:
...
...
Summierung:
...
...
...
| einen Agenten innerhalb der eingestellten $SERVICE_LEVEL_SECONDS vermittelt |
|
...
| wurden im jeweiligen Zeitintervall. |
|
...
Berechnung:
...
...
Summierung:
...
...
| Anzahl der Anrufe, die in der ACD Queue aufgelegt haben innerhalb der eingestellten $SHORT_HANGUP_ |
|
...
| SECONDS im jeweiligen Zeitintervall. | | TransferCalls |
|
...
Berechnung:
...
Summierung:
IFNULL( SUM( GroupCalls.IsTransferCall ), 0 ) AS TransferCalls,
...
...
...
| im jeweiligen Zeitintervall. | | DownSkillCalls |
|
...
Berechnung:
...
...
Summierung:
IFNULL( SUM( GroupCalls.IsAgentCallDownSkill ), 0 ) AS DownSkillCalls,
| Anzahl der Anrufe, die an |
|
...
| einen Agenten vermittelt wurden, der durch eine Skillkorrektur einen höheren Skill zugewiesen bekommen hatte |
|
...
| im jeweiligen Zeitintervall. | | SameSkillCalls |
|
...
CASE
WHEN dtAgentConnect IS NULL THEN 0
WHEN nSkillAfterCorrection = nSkillReal THEN 1
ELSE 0
END AS IsAgentCallSameSkill,
Summierung:
IFNULL( SUM( GroupCalls.IsAgentCallSameSkill ), 0 ) AS SameSkillCalls,
| Anzahl der Anrufe, die an |
|
...
| einen Agenten vermittelt wurden, der |
|
...
| keine Skillkorrektur zugewiesen bekommen hatte |
|
...
| im jeweiligen Zeitintervall. |
|
...
Berechnung:
...
...
Summierung:
| UpSkillCalls | Anzahl der Anrufe die, an |
|
...
| einen Agenten vermittelt wurden, der durch eine Skillkorrektur einen niedrigeren Skill zugewiesen bekommen hatte |
|
...
| im jeweiligen Zeitintervall. |
|
...
| Beschreibung |
|---|
| Agenten Kuchen |
|
...
Berechnung:
var wallboard2StatisticsAgentsPie_pieData = [
{
value: #{item.agentsFree},
color:"#169A13"
},
{
value : #{item.agentsBusy},
color : "#BB0F18"
},
{
value : #{item.agentsPause},
color : "#FFFF66"
},
{
value : #{item.agentsPostCall},
color : "#FCC10F"
},
{
value : #{item.agentsTotal -
item.agentsFree -
item.agentsBusy -
item.agentsPause -
item.agentsPostCall},
color : "#888888"
}];
 Image Added Image Added | Zeigt ein Kuchendiagramm der Agentenstati mit folgenden Farben / Daten: - Grün = "Supervisor - Echtzeit - Agenten - Frei".
- Rot = "Supervisor - Echtzeit - Agenten - Im Gespräch".
- Gelb = "Supervisor - Echtzeit - Agenten - Pause".
- Orange = "Supervisor - Echtzeit - Agenten - Nachbearbeitung".
- Grau = Gesamtzahl der Agenten minus allen anderen Werten.
| | Agenten Polar |
|
...
 Image Added Image Added | Zeigt als Polardiagramm die gleichen Daten an, wie der Agenten Kuchen. | | Akt. Servicelevel Tacho % |
|
...
Berechnung:
<ui:param name="item_serviceLevelPercent" value="#{item.actCalls eq 0 ? 0 : item.inServiceCalls * 100 / item.actCalls}"/>
Anzeige:
#{acdSupervisorGraphDataBean.serviceLevelGaugeData(item_serviceLevelPercent)}
 Image Added Image Added | Zeigt den Wert "Supervisor - Echtzeit - |
|
...
Berechnung:
<ui:param name="item2_serviceLevelPercent" value="#{item2.TodayGroupCalls eq 0 ? 0 : item2.TodayVariableInServiceLevelCalls * 100 / item2.TodayGroupCalls}"/>
Anzeige:
...
| Servicelevel" als Tachonadel an. | | Servicelevel Heute Tacho % |
|
...
 Image Added Image Added | Zeigt den Wert "Supervisor - Tagesstatistik - |
|
...
| Servicelevel - In Service" als Tachonadel an. | | Anrufe Heute Liniendiagramm |
|
...
Berechnung:
DataCache_AcdGroups_TodaysGraphData.sql
Anzeige:
var wallboard2StatisticsCallsTodayGraph_group_#{item.ID}_Data = {
labels : #{acdSupervisorGraphDataBean.callCountersGraphLabels(item.ID)},
datasets : [
{
fillColor : "rgba(230,170,0,0.5)",
strokeColor : "rgba(230,170,0,1)",
pointColor : "rgba(230,170,0,1)",
pointStrokeColor : "#fff",
data : #{acdSupervisorGraphDataBean.callCountersIncomingCalls(item.ID)}
},
{
fillColor : "rgba(22,154,19,0.5)",
strokeColor : "rgba(22,154,19,1)",
pointColor : "rgba(22,154,19,1)",
pointStrokeColor : "#fff",
data : #{acdSupervisorGraphDataBean.callCountersServicedCalls(item.ID)}
}
]
};
...
Zeigt folgende Daten als Liniendiagramm an:
Gelb: IncomingCalls für den jeweiligen Zeitraum.
Grün: ServicedCalls für den jeweiligen Zeitraum.
|  Image Added Image Added | Zeigt folgende Daten als Liniendiagramm an: - Gelb: IncomingCalls für den jeweiligen Zeitraum.
- Grün: ServicedCalls für den jeweiligen Zeitraum.
| | Anrufe Heute Balkendiagramm |  Image Added Image Added | Zeigt als Balkendiagramm die gleichen Daten an wie "Anrufe Heute Liniendiagramm". | | Service und Erreichbarkeit Diagramm |  Image Added Image Added | Zeigt als Liniendiagramm folgende Werte an: - Rot: IncomingCalls
- Blau: ServicedCalls
- Grün: InServiceCalls
- Dunkelrot / Braun: ShortHangupCalls
- Cyan: TransferCalls
| | Service und Erreichbarkeit Diagramm Eingegangen, Bearbeitet und In Service |  Image Added Image Added | Zeigt als Liniendiagramm folgende Werte an: - Rot: IncomingCalls
- Blau: ServicedCalls
- Grün: InServiceCalls
| | Service und Erreichbarkeit Diagramm Kurzabbrecher und Weitergeleitet |  Image Added Image Added | Zeigt als Liniendiagramm folgende Werte an: - Dunkelrot: ShortHangupCalls
- Cyan: TransferCalls
| | Up- und Downskill Agenten Anruf-Grafik |  Image Added Image Added | Zeigt als gestapelte Balkengrafik folgende Daten an: - Rot: NotServicedCalls
- Hellgrün: UpSkillCalls
- Mittelgrün: SameSkillCalls
- Dunkelgrün: DownSkillCalls
|
|
| Sv translation |
|---|
|
Superviseur - Paramètres de l'entête| Variable | Valeur |
|---|
$INTERVAL_MINUTES | Image Added | $SERVICE_LEVEL_SECONDS | Image Added | | $SHORT_HANGUP_SECONDS | Image Added |
Données pour les graphiques| Valeur | Commentaire |
|---|
| Source | DataCache_AcdGroups_TodaysGraphData.sql | | Tableaux | AcdStatisticsPartB, StatisticsPartB (CACHE) | | Restriction | Appels pour le groupe ACD respectif dans la période affichée, uniquement les appels terminés. |
| Valeur | Commentaire |
|---|
| Intervalle | L'intervalle respectif au cours de la journée entre 0 ... 23 (pendant des heures), de 0 ... 47 (pour les intervalles de 30 minutes) et 0 ...95 (pour les intervalles de 15 minutes). | | IncomingCalls | Nombre d'appels entrants vers le groupe ACD dans l'intervalle de temps correspondant. | | ServicedCalls | Nombre d'appels qui ont été transférés à un agent dans l'intervalle de temps correspondant. | | InServiceCalls | Nombre d'appels transférés à un agent dans l'ensemble $SERVICE_LEVEL_SECONDS dans l'intervalle de temps correspondant. | | ShortHangupCalls | Nombre d'appels qui ont raccroché dans la file d'attente de l'ACD dans l'intervalle de temps défini $SHORT_HANGUP_SECONDS | | TransferCalls | Nombre d'appels qui ont été transférés dans l'intervalle de temps correspondant. | | DownSkillCalls | Nombre d'appels qui ont été transférés à un agent qui s'est vu attribuer une compétence supérieure par une correction de compétence dans l'intervalle de temps respectif. | | SameSkillCalls | Nombre d'appels qui ont été transférés à un agent qui n'a pas reçu de correction de compétence dans l'intervalle de temps correspondant. | | UpSkillCalls | Nombre d'appels qui ont été transférés à un agent qui s'était vu attribuer une compétence inférieure par une correction de compétence dans l'intervalle de temps respectif. |
| Kachel | Bild | Description |
|---|
| Agents Pie | Image Added | Affiche un diagramme circulaire des états de l'agent avec les couleurs / données suivantes : - Vert = "Superviseur - Temps réel - Agents - Gratuit".
- Rouge = "Superviseur - Temps réel - Agents - En service".
- Jaune = "Superviseur - temps réel - agents - pause".
- Orange = "Superviseur - temps réel - agents - post-traitement".
- Gris = nombre total d'agents moins toutes les autres valeurs.
| | Agents Polaires | Image Added | Affiche les mêmes données que le gâteau d'agents sous la forme d'un diagramme polaire. | | Jauge du niveau de service actuel en %. | Image Added | Affiche la valeur "Superviseur - temps réel - niveau de service" comme indicateur de vitesse. | | Niveau de service aujourd'hui Jauge %. | Image Added | Affiche la valeur "Superviseur - Statistiques journalières - Niveau de service - En service" comme indicateur de vitesse. | | Graphique des appels d'aujourd'hui | Image Added | Affiche les données suivantes sous forme de graphique linéaire : - Yellow: IncomingCalls pour la période respective.
- Green: ServicedCalls pour la période concernée.
| | Graphique en barres des appels d'aujourd'hui | Image Added | Affiche les mêmes données que le "Graphique linéaire pour l'appel d'aujourd'hui" sous forme de diagramme à barres. | | Graphique de service et de disponibilité | Image Added | Affiche les valeurs suivantes sous forme d'un graphique linéaire : - Red: IncomingCalls
- Blue: ServicedCalls
- Green: InServiceCalls
- Rouge foncé / marron: ShortHangupCalls
- Cyan: TransferCalls
| | Graphique de service et de disponibilité en entrée, en service et en maintenance | Image Added | Affiche les valeurs suivantes sous forme d'un graphique linéaire : - Rouge: IncomingCalls
- Blue: ServicedCalls
- Green: InServiceCalls
| | Graphique de service et de disponibilité Raccrochages et transferts courts | Image Added | Affiche les valeurs suivantes sous forme d'un graphique linéaire : - Rouge foncé : ShortHangupCalls
- Cyan: TransferCalls
| | Graphique des appels des agents de haut-et-bas compétence | Image Added | Affiche les données suivantes sous la forme d'un graphique à barres superposées : - Rouge: NotServicedCalls
- Vert clair: UpSkillCalls
- Vert moyen: SameSkillCalls
- Vert foncé: DownSkillCalls
|
|
...
...


