| Kachel | Bild | Description |
|---|
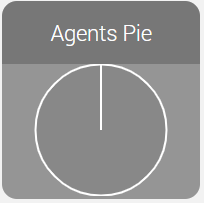
| Agents Pie | | Affiche un diagramme circulaire des états de l'agent avec les couleurs / données suivantes : - Vert = "Superviseur - Temps réel - Agents - Gratuit".
- Rouge = "Superviseur - Temps réel - Agents - En service".
- Jaune = "Superviseur - temps réel - agents - pause".
- Orange = "Superviseur - temps réel - agents - post-traitement".
- Gris = nombre total d'agents moins toutes les autres valeurs.
|
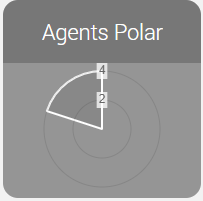
| Agents Polaires | | Affiche les mêmes données que le gâteau d'agents sous la forme d'un diagramme polaire. |
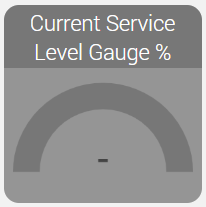
| Jauge du niveau de service actuel en %. | | Affiche la valeur "Superviseur - temps réel - niveau de service" comme indicateur de vitesse. |
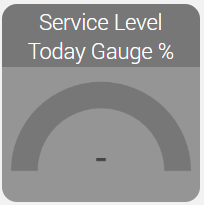
| Niveau de service aujourd'hui Jauge %. | | Affiche la valeur "Superviseur - Statistiques journalières - Niveau de service - En service" comme indicateur de vitesse. |
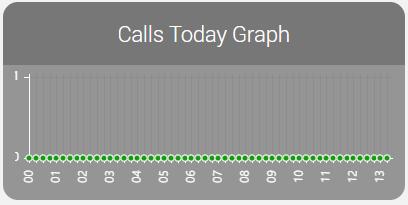
| Graphique des appels d'aujourd'hui | | Affiche les données suivantes sous forme de graphique linéaire : - Jaune: IncomingCalls pour la période respective.
- Green: ServicedCalls pour la période concernée.
|
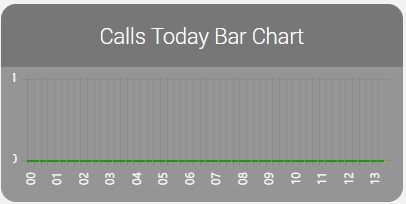
| Graphique en barres des appels d'aujourd'hui | | Affiche les mêmes données que le "Graphique linéaire pour l'appel d'aujourd'hui" sous forme de diagramme à barres. |
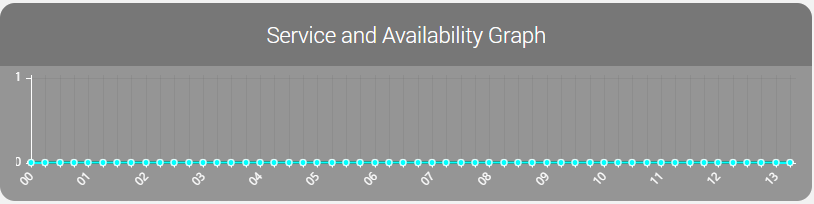
| Graphique de service et de disponibilité | | Affiche les valeurs suivantes sous forme d'un graphique linéaire : - Red: IncomingCalls
- Blue: ServicedCalls
- Green: InServiceCalls
- Rouge foncé / marron: ShortHangupCalls
- Cyan: TransferCalls
|
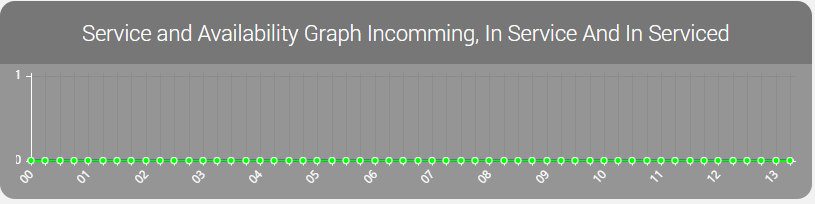
| Graphique de service et de disponibilité en entrée, en service et en maintenance | | Affiche les valeurs suivantes sous forme d'un graphique linéaire : - Rouge: IncomingCalls
- Blue: ServicedCalls
- Green: InServiceCalls
|
| Graphique de service et de disponibilité Raccrochages et transferts courts | | Affiche les valeurs suivantes sous forme d'un graphique linéaire : - Rouge foncé : ShortHangupCalls
- Cyan: TransferCalls
|
| Graphique des appels des agents de haut-et-bas compétence | | Affiche les données suivantes sous la forme d'un graphique à barres superposées : - Rouge: NotServicedCalls
- Vert clair: UpSkillCalls
- Vert moyen: SameSkillCalls
- Vert foncé: DownSkillCalls
|