The system can be fully operated by means of an internet browser. After logging in, you can see the menu on the left hand side of the browser window, which gives access to all available functions.
Menu
After logging in, you will be shown the home screen. Using the menu on the left side of the screen you can access important system functions. You can see the functions and applications to which your accound has been granted access. Note, that depending on your login, i.e. the currently logged in user, different software functions may be visible and usable.
Extract from the menu:

The menu entries are arranged in alphabetical order. In this document, most functions are described in the Administration chapter. The administration functions comprise user management, prompt management, contacts, document and settings management. You will need these functions to administer all applications. Functions which mainly refer to ACD, Network IVR and the Conference Server, can be found in the respective chapter.
When you choose a function in the menu, a window is shown which shows you data and settings relevant to the actual function.
Please do not use the forwards and backwards buttons in the browser to navigate between screens and functions.
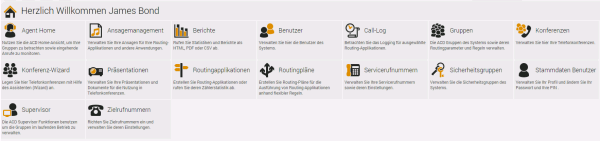
Home Screen Buttons
After logging in, you can see on the right next to the menu a selection of functions which you can access by clicking (as an alternative to the menu selection). Example:
Data Tables
When you select a function, the home screen (or previous screen) is replaced by a screen showing data pertaining to the selected function. Example:
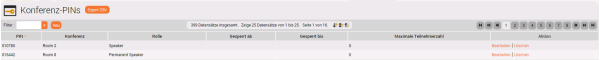
In a lot of cases, you will see a table of data associated with the function, as it is displayed in the example Conference PINs. If words in the table are shown in a different colour, then they are usually clickable links which represent commands operating on the row of data, for example Edit or Delete. You can sort the table data by clicking on one of the column headers.
In the header of some columns you can see the symbols  and
and  . These are used to control the visibility of data in the table. When you click on
  a dialog is shown which allows you to select rows which are shown in the table. When you click on a dialog is shown which allows you to determine what columns are shown in the table. The selection of rows and columns is performed using the arrow keys between the available and selected lists. The order of the columns can be determined using the arrows of margin on the right. Furthermore, as a supervisor groups can be sorted any way that you like. Therefore please use the sort commands Up and Down. Settings are saved using Save, and can be Reset or set back to the system Standard values.
The plus and minus symbols  at the bottom of a table are used to determine the number of displayed rows. This setting is saved in your user account. As several tables are refreshed in short intervals by the system, the number of displayed rows should not exceed the size of the browser window, to save resources and increase performance. I.e. it is more efficient, to change to page 2 or 3, rather than scroll in the window. The maximum number of rows is limited to 50.
In many cases the data for a function is split up into many tables, which you can view by selecting the relevant tabs at the top of the data area. Example:

Toolbar
At the top of the work area to the right of the icon depicting the current function, you can see the toolbar. Depending on the selected system function, instructions on buttons and tools are selectable here, for example New to create a new record. Using the arrow buttons, you can navigate through multi page tables. The filter function allows you to enter characters, to selectively display items in a table. The filter always applies to the column by which the data table is currently sorted.
Example Icon and Toolbar:

When searching, you can also use % as a wildcard.
Work Break Indicator
On the right of the toolbar respectively on the left, you can see the Work Break Indicator of the currently logged in user. On the right side the client work break indicator is displayed. The group work break indicator is displayed on the left hand side in agent home, when you select the details of a particular group.

The work break indicators show, referring to the client (client status) respectively referring to the current ACD Group (group status) if it is possible and sensible to set the pause mode. The number of available pause slots N is calculated in proportion to the number of logged in agents. A setting in the ACD Group (Agent Group) is programmed for this purpose.
The status information will indicate:
- Green= to set the pause mode is currently no problem. N > 0.
- Yellow= marginally acceptable. No spaces available, N=0.
- Red= to set the pause mode is currently a problem because there are not enough agents available to answer the calls. N < 0.
To receive further information in the form of a tool tip move the mouse over the status information.
Status Information
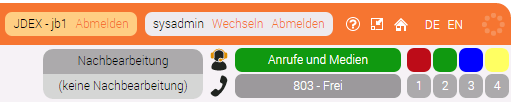
To the right of the toolbar, you can see the status of the currently logged in user. Example:
Note: The displayed status categories and their colours can be different from those displayed in this example.
Depicted from left to right are:
Coloured squares, which enable you to define the ACD status of the user (if this user is for example an agent in the call center). The colours equate to the defined Agent Status. The squares are only visible for users who are associated with an ACD group. One click is enough to change the status. When changing from a not logged in status, to a logged in status, the first available telephone number from the user account is used. Via the grey squares with a preconfigured number you can switch between the configured telephone numbers in the user account. These fields are only visible for user accounts who are associated with an ACD group.
Note: The status manual post call does not end automatically, and is ended only when the user chooses another status category.
The current ACD status of the user, and the telephone number of the agent (possibly shortened). Clicking on either displays a popup dialog in which both the status and the telephone number can be changed simultaneously. Alternatively, use the previously described coloured dots. Below the current phone number and the phone status are displayed. Through a button (x) at the phone status, the agent can set oneself to Free, if the ACD has not been able to detect the status. This can, for example, be a good idea if agents transfer a call within their PBX systems rather than using the ACD functions. In so doing, agents can activate themselves, and receive further calls. Note, that using this function can not be equated with “rejecting” a call. The call itself is not disconnected and remains in the ringing or connected state. Only the status of the agent in the ACD is changed.
The user, whose identity is being impersonated by the currently logged in user. Use Logout to leave the impersonated identity and return to the original user account.
The logged in user. Use Change to display a table of identities which you can change to, assuming the rights to use that function are granted to your account.
Connection Status
The symbol on the right shows the status of the connection to the web server.

The colours mean:
- Grey - connection is inactive.
- Blue - connection is active, a request is currently being processed.
- Yellow - connection is slow.
- Red - connection is disconnected.
If yellow or red is being shown, try to refresh the browser using F5 to return to the main screen. If this does not work, then the connection is broken and you will need to login to the system again.
Icons
In the left and right corner of the screen, you can see further icons.
On the right side:

The question mark is used to access the online help.
The home symbol is used to return to the home page of the system.
Use Logout to log off the system completely. Depending on the configuration of the system, a button also might be displayed for this option.
Use the flag symbols to change the language in which the system is displayed. Simply click on the desired flag to select the language you require. The initially displayed language depends on the settings in your internet browser. If you have, for example, setup English as a higher priority language than German, then you will initially see the portal in English. Currently loaded data will not be translated when the language is changed. To translate the data, you need to access the function from the menu again. The captions and menu options are, however, immediately changed.
Status Bar
The status bar at the bottom of the screen shows the following:
Version: The product name and exact version (build) of the software.
Current User
Support address (this can be modified by the reseller)
Example:
